Data Input
Data Structure Types
Caution
! X-axis units need to be in cm-1
Prior to importing data, the spectral data has to be exported from the device’s manufacturer software in one of the supported formats:
*.spc data files with single or multiple Raman spectra (tested with WITec and Renishaw devices). May fail to parse the date automatically, so the date should be provided in the metadata.
*.jdx files with single or multiple spectra in the same format as *.txt files below. Lines that start with "#" are ignored (except for Renishaw format).
*.txt files with single spectra. The files should contain wavenumbers in a first column and the spectral intensities in the second column. The columns should be separated with a tab stop symbol. No additional columns/rows or column/row names are allowed.
*.txt files with multiple spectra (time series and scans). Either of the following structures can be used:
- Generic (e.g. WITec Table export) format with spectra in columns (preferably) or rows. The first column/row should contain the wavenumber axis. No additional columns/rows or column/row names are allowed.
- Spectra in rows, spectrum index or timestamp as row names, and wavenumbers as column names. The columns should be separated with a tab stop symbol.
- Format compatible with files exported from Renishaw. Spectrum indexes, timestamp, or coordinates should be indicated in columns for each wavenumber index of each spectrum; wavenumbers and the respective spectral intensities should be indicated in two columns named “#Wave” and “#Intensity”. The columns should be separated with a tab stop symbol.
*.lpe data files (native rapID BPE format) with multiple spectra.
*.wip data files from WITec. May not support special cases or all devices.
*.wdf data files from Renishaw WiRE software. May not support special cases or all devices.
*.csv file with multiple spectra and a mandatory timestamp for each spectrum. These files should contain spectra in rows, with wavenumbers specified as column names. The timestamp (YYYY-MM-DD hh:mm:ss) should be provided in the DateTime column.
*.txt and *.csv files without wavenumber axis (starting from version 0.5.1) with multiple or single spectra. Requires setting the relation between pixel index (idx) and the respective wavenumber position (wn) in the parameters file and referencing that relation in the metadata device_wn column. See an example for HT Raman below.
Supported Devices
General instruction:
- Export data using the software coupled to your Raman device.
- Structure/restructure your data to simplify the metadata file construction.
- Create a metadata file.
- Compress data and metadata to one *.zip file.
Caution
! When dates are not identified automatically by the software, the metadata file must contain the “date” column. (see Providing Metadata)
Below is a list of Raman devices which are supported by the software or used by active users. We describe here how to export data from Raman device manufacturer software in a way that it will be readable by RAMAN METRIX.
BPE (Bio Particle Explorer from rap.ID)
File format: *.lpe files - spectra in text format are compressed along with metadata and images.
Each spectrum: .txt file where data saved as a Table with two columns of data: wavenumber and spectral intensity. The timestamp is internally included in the filename (SpRaw_ YYMMDD_hhmmss.txt) and the dates will be automatically identified by the software.
Extract files using a program for unzipping archives or R script OpenLPE.R (contact Julian Hniopek).
WITec (Project Four software)
File format: *.wip files - spectra in binary format stored in WITec format can be used directly in most cases.
Alternatively, users can extract files in generic formats using Spc or Table export options in the Project FOUR software.
“Spc” and “Table” export options work for single spectra, time series and scans.
- Export --> SPC
Format: Single spectrum data, time series and scans data structure types can be exported as *.spc file.
- Export --> Table
Format: table with columns, first column – wavenumber, next columns – intensity (each column contains single spectra). Should be exported with a default Filter options: • Column Delimiter: “Tab” • Decimal Separator: “. “
- Export --> Matlab, JCAMP-DX, Graph ASCII - are not supported.
Renishaw (WiRE software)
File format: *.wdf files - spectra in binary format stored in Renishaw WiRE format can be used directly in most cases. Files from Project 7 are supported starting from RAMANMETRIX version 0.6.9.
Alternatively, users can extract files in generic formats using Renishaw WiRE software:
- Export --> SPC
Format: Single spectrum data, timeseries, and scans data structure types can be exported as *.spc file
- Export --> As txt
Format:
Single spectrum: table with columns: first column – wavenumber, second – intensity
Time series: table with three columns of data including their names (#Time, #Wave, #Intensity)
Scan: 4 columns including their names (#X, #Y, #Wave, #Intensity). Please, check that txt file is exported with:
Column Delimiter “Tab”
Decimal Separator “. “
Horiba (LabSpec software)
- Export --> SPC
Format: Single spectrum data, timeseries, and scans data structure types can be exported as *.spc file
- Table format
Format: table with spectra in rows (without row names): First row (or column names) should contain the wavenumber data
Kaiser Raman (Holograms software)
Data should be exported as *.spc files.
HT Raman (IPHT, Iwan Schie)
Data is saved as intensities with single or multiple spectra per file without wavenumbers.
The wavenumber axis can be preset in data_device_wn field of parameters file in the following way:
"data_device_wn": {
    "HTS": {"idx": [25, 180, 445, 966, 1029], "wn": [329, 858, 1648, 2931, 3064], "polyorder": 2},
    "HTS-inverse": {"idx": [123, 381, 819, 1694, 1803], "wn": [329, 858, 1648, 2931, 3064],"polyorder": 2}}
  }
Then, the wavenumber axis can be linked to the data by setting values in device_wn metadata column to HTS (or HTS-inverse for the inverse HTS setup).
ELODIZ (SOMPAS software)
File format: SOMPAS *.txt and *.csv files with a custom structure.
Starting from RAMANMETRIX version 0.6.9, SOMPAS files can be imported in RAMANMETRIX without conversion. If columns Raman_Shift and Processed_Data are available, then they will be used. Otherwise, previous columns will be used (e.g Pixels and Raw_Data).
File format: *.cha files support is not yet implemented.
Providing Metadata
There are two ways to provide metadata: folder structure and a metadata table. Both can be used simultaneously, but values from a metadata table overwrite the labels obtained from the folder structure.
The metadata are needed for calibration, cross-validation, predictive modeling, and data visualization. For example, standard spectra are linked to the sample spectra both by the device name and by the dates from the timestamps.
Intensity calibration and dark background subtraction can only be performed if respective measurements are specified in the metadata table.
Prior to importing the data, the files with spectral data and, optionally, the metadata files should be packed into a ZIP archive.
Generate metadata template
A template for the metadata table can be generated for the specific dataset. To do so, import the ZIP file with spectra, and then click "Export" and then "Templates for metadata".
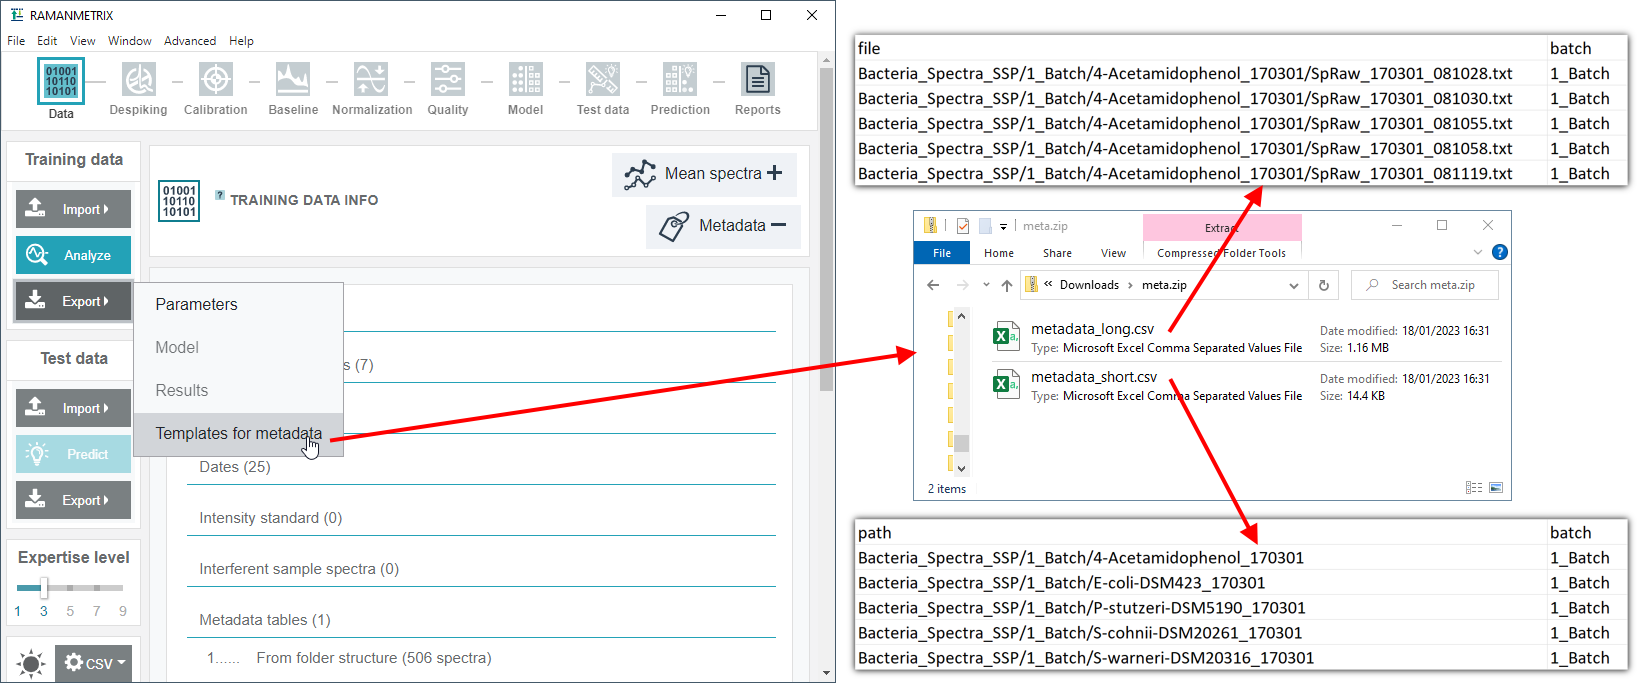
Tips
If the CSV file are not displayed correctly, adjust th CSV settings at the bottom of the RAMANMETRIX left panel.
Alternatively, the metadata template can be generated using the stand-alone Metadata loader tool.
Metadata Table
Tips
Automatically generated metadata templates (see Generate metadata template below) can save a lot of time, especially for larger data sets.
The metadata should be provided in the form of a table, saved as a CSV, XLS, or XLSX file within the ZIP file in addition to the data. Multiple metadata files are allowed (e.g. one per replicate). The filename of metadata file should always contain the word “metadata”.
The default columns (case-sensitive names) are:
- file or path: starting pattern of the file path within the ZIP file. Either full path to the file or a starting pattern of the full path should be specified. If ambiguous patterns are specified, then the longer pattern has a priority (e.g. values in row “folder/subfolder/” will overwrite metadata for the spectra in the subfolder, even if different metadata are set for the “folder/”). From version 0.5.1 values "*" and "." are special path values that refer to all data that are not listed in the metadata table. If no metadata is provided, then the “file” column will be identical to filename and metadata are generated from the folder structure.
- include: boolean (True or False values). “True” by default. All spectra labeled as “False” are excluded.
- device_wn (starting from version 0.5.1): character string referencing custom wavenumber axis defined in from parameters file. Can be useful if the wavenumber axis is missing or is wrong in the files. Set this value to "HTS" for using wavenumber axis preset for HT Raman.
- standard: boolean. “False” by default. “True” value indicates the files with wavenumber calibration standard.
- standard_intensity: boolean. “False” by default. Indicates the files with intensity standard spectra. The column may be skipped if no intensity standard was measured.
- dark_bg: boolean. “False” by default. Indicates the files with dark background spectra. The column may be skipped if no dark background was measured.
- reference_sample: boolean. “False” by default. Indicates the files that should only be used as reference EMSC and quality filters based on correlation. If the column is skipped, mean spectrum over the dataset is used as the reference.
- interferent_sample: boolean. “False” by default. Indicates the files that should only be used as interferent EMSC spectra. The spectra indicated in this column are averaged according to the “type” groupping and can be selected at the background correction step.
- qual_ignore: boolean. Not specified by default. When “True”, indicates the files that should always pass quality filters. May be useful for test data.
- date: dates of measurements. Used at wavenumber and (optionally) intensity calibration steps, as data from each date is calibrated separately. Should be specified if the dates cannot be detected correctly from files (e.g. *.lpe,*.csv, or some *.spc file formats) and folder structure (timestamps YYMMDD_hhmmss in file/folder names).
- device: measurement device name, id, or label. Should be specified if multiple measurement devices are used. Used at calibration steps, as data from each device is calibrated separately.
- batch: default data segments for batch-out cross-validation (sets of independent measurements).
- type: default class labels (the grouping that has most relevance). Used for plotting mean spectra per group at data input and normalization steps.
Additional custom columns can be used as responses for the regression, alternative grouping for the classification and cross-validation, or to define how the spectra should be aggregated.
Metadata for the calibration
The “date” column should contain the measurement date to perform spectral calibration. If the column is missing, the timestamps from the folder structure or the dates embedded into the data object (.lpe,.csv, or some *.spc file formats) are used.
If multiple devices are used, then the “device” column need to be added.
Columns “standard”, “standard_intensity”, and “dark_bg” should contain Boolean values (true or false). The true values in the respective columns indicate the measurements of standard materials for wavenumber calibration, for intensity calibration, and dark background subtraction, respectively.
Step-by-step instruction
Metadata table can be based on automatically generated template or made from scratch.
Option 1: generate the table automatically
Import ZIP file with spectra in RAMANMETRIX.
Use Generate metadata template option to get the CSV templates.
Among the exported CSV files (short, long, or auto) select the one most representative for your data set.
Adjust the inputs that were not detected correctly from the folder structure. If needed, add missing or custom columns.
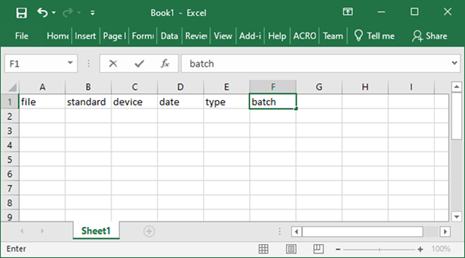
Option 2: create a metadata table from scratch
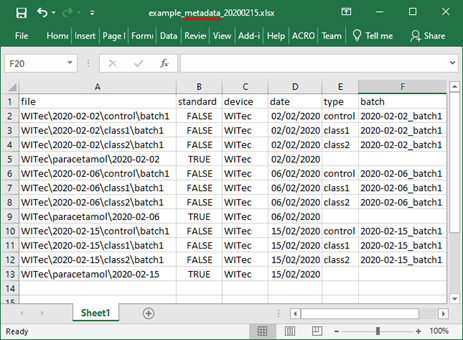
Open MS Excel and name the columns “file”, “standard”, “device”, “date”, “type”, and “batch”.
TIPS
a. You may add other columns with important information about the samples and use the order of the columns that is convenient for you.
b. If the intensity standard or dark current were measured, then the columns “standard_intensity” and “dark_bg” ( respectively) should be added to the table and used in a way similar to the “standard” column.
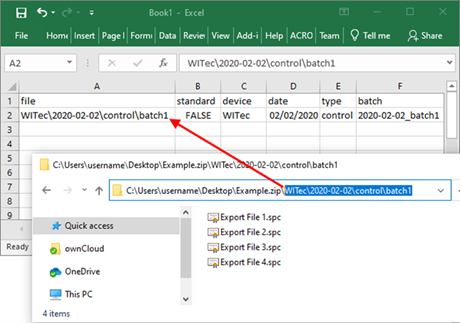
Copy the path to the data files within the ZIP file to the metadata table and fill out the other columns of the metadata table. For the sample data set value in “standard” column to FALSE.
Copy the path to the standard data, set value in a “standard” column into “TRUE”, specify the device and the date of measurement in the respective columns.
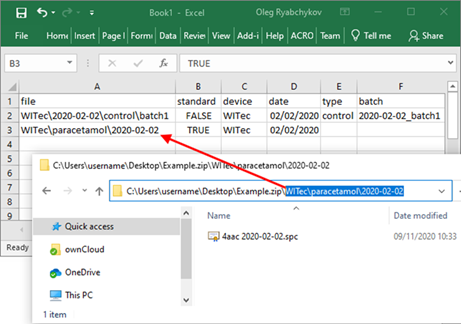
Repeat the process for each folder
Importing metadata
The metadata metadata table should be saved as XLSX or CSV with the word “metadata” in the filename.
Option 1: importing metadata separately
If the metadata files are imported separately, the full path to spectral files within the ZIP file should be specified in the metadata files. The imported metadata overwrites all other metadata.
Import ZIP file with spectra into RAMANMETRIX.
Click Import -> Metadata table(s) and select one or more metadata files to be imported.
Option 2: importing metadata together with spectra
If the metadata files are located within the ZIP file, the path to spectral files should be specified in the metadata files relatively to the metadata files location.
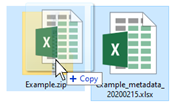
Put one (or multiple) the metadata file inside the ZIP file with spectra (e.g. using “Drag and drop” method).
Import ZIP file with spectra into RAMANMETRIX.
Defined from the folder structure
Tips
It is preferred to provide the metadata table rather than rely on the automated parsing of folder structure.
Besides providing labels as a separate metadata file, the files might be organized into a specific folder structure that represents labels:
Files with single spectra have to be placed in the folders of the following structure: .../$type/$batch/$SingleSpectrumFile.txt”
Files with multiple spectra are considered as batches, so no additional folder for batches should be created. Instead, they should be placed in: “.../$type/”
Standard spectra (or folders with standard spectra) should be placed in subfolders which name equals to “AAP” or contains “4-AAP” or “4AAP”.
The timestamps are embedded in the .spc,.lpe, and *.csv files and can be automatically detected in most cases.
The last occuring pattern YYMMDD_hhmmss (or YYMMDD-hhmmss) in the file path is interpreted as timestamp. For example, the timestamp “190530_121519” will be taken from the file, path to which is “data_0/e12300123_102030/s19161010_151515/May30batch2/Sp_20190530_121519.txt”.
If the dates cannot be detected correctly from folder structure or file content, the date should be specified in the metadata file.
If no info about measurement date is detected, then the batch name is used to link standard data to the sample data. In this case, the standard spectra should be placed in folders named according to the batch/replicate labels inside the folders with standard data (for example in “data_0/AAC/May30batch2/”).
When the standard spectra are not available or cannot be linked to the data correctly using the date, the data are approximated onto the new wavenumber axis without calibration.