Software releases
0.7.x
🐞 Bug Fixes
- Fix a bug in testing stating that invalid model is used when using PCA or SVM
🎉 New Features
- Show credibility intervals (95% CrI) for classification metrics
🔨 Other updates
- Show the exact (v0.7.3) version number in the online deployments
🐞 Bug Fixes
- Load TXT/JDX files with trailing spaces correctly
🎉 New Features
- Show the version number in the online deployments
🔨 Other updates
- Add a possibility of restrictive licenses
🐞 Bug Fixes
- Avoid unnecessary intensity calibration of dark background spectra
- Avoid accidental normalization of standard spectra
- Make HM model scores unique even when the same peak position is used multiple times
🎉 New Features
- Add
qual_ignorecolumn to metadata, so users can indicate which spectra should always pass quality filters. This could be useful in testing - Add
(i)option for PCA-based models where PCA is done inside CV
🔨 Other updates
- Update scikit-learn backend
- Refactor CV to make adding more model types in future easier
ATTENTION!
Models and parameters from older versions before 0.7.0 might behave unexpectedly due to changes in: file import refactoring, dark background correction option at despiking step, refactoring and adding options for calibration, EMSC correction refactoring.
🐞 Bug Fixes
- Intensity calibration can now be done if wavenumber calibration is skipped
- Lorentzian fit formula
- Appearance of PCA components for interferent spectra in EMSC
- Possibility to have different
device_wnfor the same device
🎉 New Features
- Dark background correction prior to despiking
- New modes for intensity and wavenumber calibration, based on measurement time:
nearest,previous, ornext - Added a possibility to only keep metadata mentioned in
"metadata_parsers"by setting"full_metadata_keep": Falsein the parameters along with"full_metadata_load": True
🔨 Other updates
- Speed up TXT file parsing
- Removed unused/broken
Customized from folder structureoption - Remove interference from EMSC reference prior to EMSC
- Renamed
full_metadataparameter in data loaders intofull_metadata_load
0.6.x
ATTENTION!
Behaviour of correlation-based quality check filter in models exported from older versions might change starting from 0.6.0!
🐞 Bug Fixes
- Corrected legend of model coefficients in case of binary classification by plotting two coefficient traces for each class
- Improved stability of the JHub online version by retrying on authentication errors
🎉 New Features
- Enable import of parameters before importing data (to update
data_loadersparameters that should be updated before loading data)
🔨 Other updates
- Updated default parameters for compatibility with HTS-Raman (set min_wn_length to 250 and added new devices)
- Add info on how CV is performed with different dimension reduction techniques
- Proofread error messages
🐞 Bug Fixes
- Fixed download of results, which was stuck for files over 10 MB
🐞 Bug Fixes
- Adjusted behavior to avoid displaying previous results instead of the current analysis, which mostly affected the online versions
- Fixed appearance of mean spectra after import in case of NA values in data
- Fixed error on exporting results without spectra in JHub version
🎉 New Features
- Implemented automated metadata readout from JCAMP-DX and WiTec WIP files (can be enabled by setting
data_loaders.full_metadatato True in the parameters) - Implemented
data_loaders.metadata_parsersto enable custom conversion of metadata from files into columns expected by RAMANMETRIX - While using pyRamanmetrix, make it possible to load data from single or multiple spectra files (Previously was only possible from a ZIP file or from a folder)
🔨 Other updates
- Limited upload size for data import in the online version to avoid unreasonably long time for importing data (large files can be imported via
Load from link) - In default parameters set priority to consider spectra to be in rows (if the orientation cannot be determined otherwise by setting
data_loaders.default_incolsto False
🐞 Bug Fixes
- Fixed detection of orientation in files without wavenumber axis
- Avoid crashing on loading 0-intensity wavenumber reference
- Disabled "Inverted X" for regression plot
🎉 New Features
- New modes for dark background correction, based on measurement time: nearest, previous, or next
- Warnings for low or high interpolation step sizes
- Added CSV export to scatterplot
- General settings on the left menu is expanded with PNG scale to change the image resolution
- New export settings for the png files: resolution(scale), size, axis and line width
🔨 Other updates
- Added
stepslist with spectra at each preprocessing step topredict_jsonAPI - Sort data by path for consistent 10-fold CV
- Changing the y-label depending on whether the data is normalized
🐞 Bug Fixes
- A fix to avoid timeout error when generating mean raw spectra for large datasets
🎉 New Features
- New modes for dark background correction, based on measurement time: nearest, previous, or next
🔨 Other updates
- Introduced
datetimecolumn to metadata which is currently parsed from filename or spectrum ID - Optimized large data import in the desktop version
🐞 Bug Fixes
- Fixed error when calculating difference spectra based on numeric labels
- Improved handling of large file downloads in the online version
- Correctly parse dates in the new format used in some SPC files
- Added compatibility with WiTec Project 7 and ELODIZ SOMPAS file formats
🎉 New Features
- Load data from a public URL share (direct upload, Nextcloud or OneDrive)
- Hard modelling (HM) based on average or integrated peak intensities
- Normalise raw data to
integration_time_s(if specified in the metadata table) to account for different integration times during intensity calibration
🔨 Other updates
- Limited number of plotted labels to improve frontend performance (adjustable via
data_loaders.max_labelin the parameters file) - Added
quality_failed_actionparameter to thepredict_dictbackend API to allow retention of spectra that failed the quality check - Display progress on the frontend for different steps
- Dockerised version for integration with Jupyter Hub
- Added wavenumber axis for HTS-inverse (IPHT) device to default parameters
🐞 Bug Fixes
- Legend labels in scatterplot
- Enable detection of date in both new and old WIP file format
- Intensity calibration axis conversion in case of intensity reference provided in nm
🎉 New Features
- Plot PCA-SVM coefficients when linear kernel is used
🐞 Bug Fixes
- Fix export of cluster maps
- Fix use of clusters as included labels for clustering
- Fix automated detection of maps for Horiba and Renishaw
🐞 Bug Fixes
- Legend color inconsistency between cluster tree and mean classes plot
- Fixed appearance of controls for HM-HCA in model step
- In regression results table plot all rows when there are more responses than concentrations
- Correct minor typos in helper text
🎉 New Features
- Plot maps of class predictions similarly to cluster predictions (when spectral mapping information is available)
- Export results without calibrated and preprocessed spectra (useful for large data sets, available for high expertise)
- Add various aggregation options besides averaging (backend only, available via parameters file): 'mean', 'median', 'sd', MAD ('medad'), MAD from min ('minad')
- Import data directly from clouds (available in pyRamanmetrix and Backend APIs
🔨 Other updates
- Improved model interpretability via named legend in coefficients plots of PLS2, PCA-LDA, PCA-LM, etc.
- Import of multiple ZIP files together
- Handle dates in German in WiTec files
🐞 Bug Fixes
- Wavenumber axis detection failed when the spectral resolution does not increase monotonously; fixed by setting
wn_check_toldata loader parameter
🎉 New Features
- Calculate derivative of spectra during preprocessing (at calibration step)
- SNV and Min-Max normalization options
- The results table and mean spectral plots are made more compact for regression tasks; this also prevents frontend from hanging; can be controlled via
model_n_classes_maxparameter
🔨 Other updates
- In regression test NA values are handled in the results table
- Importing data directly from HTTPS link is implemented in pyRamanmetrix and for backend APIs
- Added import_txt2parameters function to pyRamanmetrix
- Added include_spectra parameter in export_results2zip of pyRamanmetrix
🐞 Bug Fixes
- Ignore excluded data when calculating average for difference plot in model step
- Enable zooming-in shortcut
Ctrl++for German keyboard
🎉 New Features
- Get dates automatically from new WIP file format
🔨 Other updates
- Ignore excluded data in the despiked plot
- Customized slider intervals for calibration sampling step (e.g. resolution) and SNIP iterations
🐞 Bug Fixes
- Fix reference update at calibration step
- Fix loading of Renishaw files with multiple spectra
🎉 New Features
- Compatibility with Deflate64 compression (used by Windows for large ZIPs)
- Make it possible to load WIP files from new WiTec software
🔨 Other updates
- SNIP algorithm modified to handle negative intensities (behaviour is unchanged when no negative values are present)
🐞 Bug Fixes
- Fix appearance of the last cluster in the exported cluster maps
- Fix reference update at calibration step
🎉 New Features
- kMeans clustering
- Despiking using neighbours
🔨 Other updates
- Limit number of outliers displayed in quality check, so PDF reports can be generated faster
- Refactor SpData class as subclass of photonicdata.BaseSpData
🐞 Bug Fixes
- Fixed import of files with multiple spectra
🎉 New Features
- ω⁴ correction at normalization step
🔨 Other updates
- Removed the scroll at loading logo
🐞 Bug Fixes
- Fixed import of SPC files with multiple spectra
- Improved large numbers appearance in the plots
- Fix appearance of peak positions at standard plot
- Fix calibration error when interferent spectra provided
- Set fixed random seed to make model training reproducible
- Improve logic for quality reference preprocessing
🎉 New Features
- Color palettes can be adjusted in parameters file
- Axis labels can be adjusted in parameters file
- Automatically detect dates in WIP files
- Automatically detect
x_posandy_posin 2D maps within WIP files - Export cluster maps along with results when x and y positions and clusters are available
- Use cluster predictions (after running clustering) in the 'Included labels' filter at the model step
- Check all/none box in loadings plots
🔨 Other updates
- Update API for model hierarchy to accept other conditions besides 'classes': 'notequal', 'less', 'lessequal', 'greater', 'greaterequal'
- Add 'Preprocessed reference' to quality check plots
- Use different color palettes for classes and clusters
0.5.x
🐞 Bug Fixes
- Fix error regarding missing cluster predictions when performing regression
- Catch errors on import
🔨 Other updates
- Add 'data_loaders' to parameters file
🐞 Bug Fixes
- Model persistence issue on test data import
- Loading files with different formats for the same date/device
- Error display during the calibration step
- Error handling for metadata import
- Ability to run long calculations (>12 hours) in the online version
- Open links externally
🎉 New Features
- Use clusters (after running clustering) as class labels via 'Customized from metadata' class label 'cluster_predictions'
- Combination of EMSC and SNIP for baseline correction
- Provide support for WIP files with the wavelength axis saved as a polynomial
- Import of test metadata separately from test data
- Display cross-validation progress at the model step
🔨 Other updates
- Add 'model_convert' API for converting v05 models into older v04 model versions
- Introduce 'session_download' and 'session_upload' APIs for exporting/importing sessions at the backend
- Customize 'hierarchy_predict_json' API with a filter, e.g., 'hierarchy_predict_json/predictions'
- Add 'hierarchy_predict_json_predictions' API
- Update 'predict_json' API to return top matches
- Add the option to enable ω4 correction in the parameters file
- Limit the number of rows displayed in regression results
🐞 Bug Fixes
- Appearance of test results for a single class in test data
- Fixed appearance of major vote confusion table and parameters in test report when the model is loaded in empty session
🎉 New Features
- Possibility to refer to all data by setting
.or*value in in the path (or file) column of the metadata table - Possibility to keep the calibration data after calibration in pyRamanmetrix by setting
calibrate(..., drop_calib_data=False) - Import of CSV or TXT files without wavenumber axis (see HT Raman, Data Structure Types, and Metadata Table for details)
- Added automatic date parsing from the filenames in YYYY_MM_DD format
🔨 Other updates
- Improved date parsing from the filenames in timestamp format (YYMMDD_hhmmss)
- Customized error messages when inner cross-validation (CV) fails
- Use N-fold CV with N≤10 instead of 10-fold CV if minimal number of observations per class is less than 10
- Security, performance, and compatibility updates to GUI and installer
ATTENTION! Model compatibility with previous versions is not supported!
🐞 Bug Fixes
- Correct plotting of the raw mean spectra with different wavenumber ranges
- Fixed a bug in report printing with unloaded charts
- Fixed broken chart functionality after exporting chart to PNG
- Corrected traces behavior on saving PNG
- Fixed an issue with chart traces standard deviation
🎉 New Features
- Support of SP and FSM files
- Support of TXT/CSV files with comma or semicolon separator
- Import/export of models via pyRamanmetrix
- Possibility to include/exclude spectra at the import step by indicating logical values in the include column of metadata
- Add PCA option for EMSC signal interference
🔨 Other updates
- Refactor the software, reducing the size of the setup file and the required disk space for installation by a factor of three
- Best number of features is decided at the saturation point of the fitted curve (not by maximal value)
- Updated CNN model for feature extraction to a more sophisticated but faster version
- Changed the format of PKL files for model import/export
- Website for a license and software downloads has a new domain name - desktop.ramanmetrix.eu
0.4.x
🐞 Bug Fixes
- Metadata parsing with different data types in the same column
- Correct multiple response selection in test
🎉 New Features
- New buttons in plots for mean classes. The button that makes it possible to check/uncheck all traces and the button that checks/unchecks the standard (in the raw data plot) or excluded (in the model step) data.
- In the dark mode, setting black background is now possible (useful for making screenshots for the black PowerPoint slides)
Add warnings to calibration step
Users can add an "include" column to metadata table to mark the data that has to be included (TRUE) or completely excluded (FALSE) from the whole data processing routine
A minimal HTML report with plots is exported along with the ZIP file
Speed-up SVM model training
Smoothing is added at the calibration step
More loading plots are available now for LDA and PLS-based models
Added R2 and MPE regression metrics
Added a table with metrics for all responses for multiple regression
Added predict_dict and export functions to pyRamanmetrix
Load files with ".0", ".1", ".2" extensions the same way as TXT
🎉 New Features
Introduce interferent signals to EMSC model based preprocessing by labeling those spectra in
interferent_samplecolumn of metadata table and specifying their type intypecolumnInverted X-axis option for all plots
- Slider manual input option for all sliders
- Hard modeling (HM) for feature extraction by fitting selected peaks
- Interface for setting fitted peaks for hard modeling
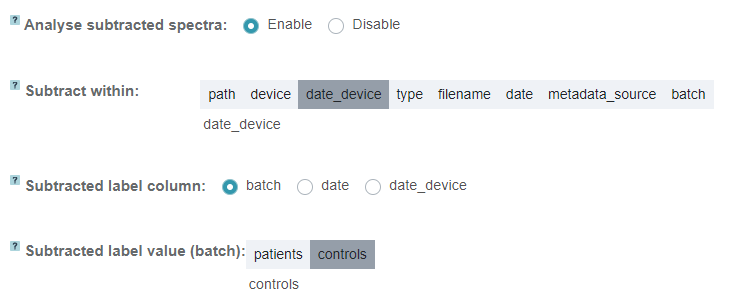
- Analysis of subtracted spectra (e.g. subtract control sample from treated)
🐞 Bug Fixes
- Step Data, metadata refresh after a new dataset upload
- Quality filters title alignment
🔨 Other updates
- Plot standard data ('standard', 'standard_intensity', 'reference_sample', 'interferent_sample', 'dark_bg') in 'Mean spectra (raw data)' plot
- Despiking step, new interval for Despiking threshold slider
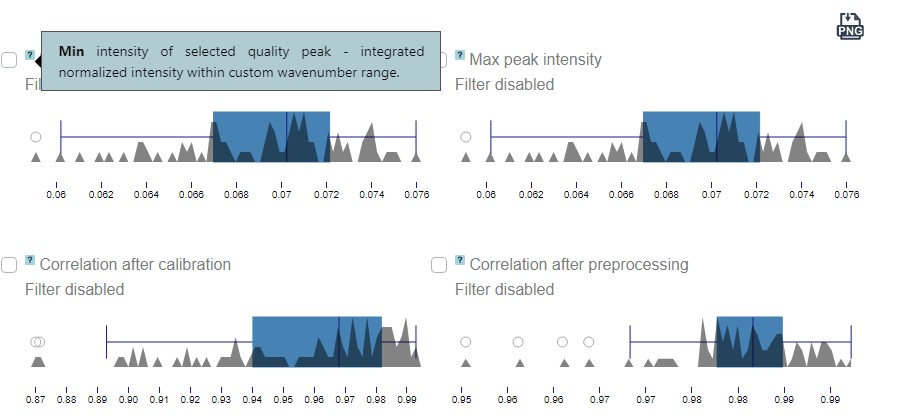
- Quality plots, tooltips added
ATTENTION! Model compatibility with previous versions is not supported!
🎉 New Features
Import functions into python 3.10.4 by importing
server/pyRamanmetrix.pyfile, e.g.import pyRamanmetrix as rm(see Tools / Python module pyRamanmetrix)Multi-response PLS regression (PLS2 and PLSW2A) models
Support of WITec (*.wip) files with Raman spectra ( see Data Input / Data structure Types)
Difference spectra plot at model step
Export -> Default parametersin high-level expertise mode
🐞 Bug Fixes
Appearance of a blank screen at the first start
Support
\in file path in metadata tableFix PLS2-DA decision-making for values outside of [0; 1] range
Avoid an error if a date cannot be recognized
Allow unsorted standard peaks in parameters.txt
Preserve zoom on saving figures as PNG
🔨 Other updates
- Inclusion of wavenumber range boundary values
0.3.x
🎉 New Features
added PLS2-DA (classification) and PLS1 (regression) models
changed design of the license window
🐞 Bug Fixes
updated labels order in scatterplot legend
avoid erasing imported raw data when the import of metadata fails
fixed breaking of the layout on window resize
🎉 New Features
- improved, fixed bugs and changed view for "included labels" feature in the model construction step
🐞 Bug Fixes
fixed errors for the sliders on the normalization and quality filters steps, that occurred when the selected calibration degree parameter is a decimal number
corrected typos in the tooltip blocks
🎉 New Features
added possibility to use reference spectra for EMSC and quality check (should be marked using 'reference_sample' column in metadata) instead of the mean over the dataset (see reference_sample in the Metadata Table)
added SD to means.csv in results
added major vote predictions (if applicable) to results
🐞 Bug Fixes
fixed bugs related to float values used as labels
fixed problem with endless animation on downloads
🔨 Other updates
optimized default parameters
added link in the menu to the documentation website
displayed errors on upload/download data
updated About page: design and list of packages
general improvements on stability, updated dependencies
🎉 New Features
improvements of data integrity, added md5 sum for models
support of JDX and Renishaw TXT files, support of Horiba XY and TXY maps ( see Supported Devices)
display warnings when failed to import files
🐞 Bug Fixes
bugs fixed for test data report and voting after a quality check
fixed appearance of the scatter plot in the test data prediction
🔨 Other updates
added plot with calibration functions to the test report
improved scatterplot: one can choose a type of the scatterplot diagonal plot (line, histogram, distribution)
🎉 New Features
added possibility to stop calculations at any step
aggregation of prediction results by voting
import metadata tables separately
🔨 Other updates
updated component for displaying backend errors
display notification about the new version
added voting results to the reports
minor bug fixes
ATTENTION! This version requires new license file!
🎉 New Features
dark mode
possibility to link license by HDD instead of MAC-address (no conflict with VPN)
usage of all available labels to exclude data from model
🐞 Bug Fixes
- some unexpected installation problems solved
🔨 Other updates
- improved quality of the plots saved in PNG format
0.2.x
🔨 Updates
New name and icon, added average spectra to the model step, updated user interface, improved plots (see Interactive plots), and fixed bugs.
🎉 New Features
Added 2-level cross-validation
Implemented automated optimization for a number of features
🎉 New Features
- Add 'shift' option on the Standard spectrum plot.
Other updates
- Improved despiking algorithm
...