Getting Started
Preparation
Please, first follow the instructions from Desktop or Online sections.
Example data
The data, parameters and models which are used in this section can be found at ramanmetrix.eu/examples/ under the "Getting started" header.
In case the desktop version of the software is used, the "Example" folder will be inside the downloaded "Ramanmetrix Setup xxx.zip" archive.
The example data set is a subset of data published in:
Kloß, S., Rösch, P., Pfister, W., Kiehntopf, M., & Popp, J. ( 2014). Toward Culture-Free Raman Spectroscopic Identification of Pathogens in Ascitic Fluid, 87(2), 937-943.
Predict test data
In the simplest configuration, a pre-trained model is used to preprocess and predict Raman spectral data. This configuration does not have any adjustable parameters. Users can only import model and data and get the prediction. To do so, follow the steps below:
Hide unnecessary controls by choosing the lowest level in the Expertise level panel.
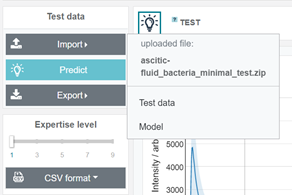
Import data using the panel named "Test data" on the left side. Click "Test data", click Import --> Test data and select a pre-structured ZIP file. An example of such a pre-structured file, named " ascitic-fluid_bacteria_minimal_test.zip", is available in the folder "Predict test data" of the provided examples.
Click on the Test data icon at the stepper on the top of the window. Check the mean spectrum of the imported data and the summary on metadata (list of batches, classes, available standard data, etc.)
Import a pre-built model by clicking Import --> Model. Select one of the *.pkl files from the "Predict test data" folder.
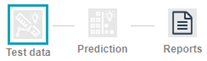
Click the "Predict" button at the left panel. The data preprocessing and analysis will take a few seconds. The result of the prediction can be accessed by clicking on the Prediction icon at the top panel.
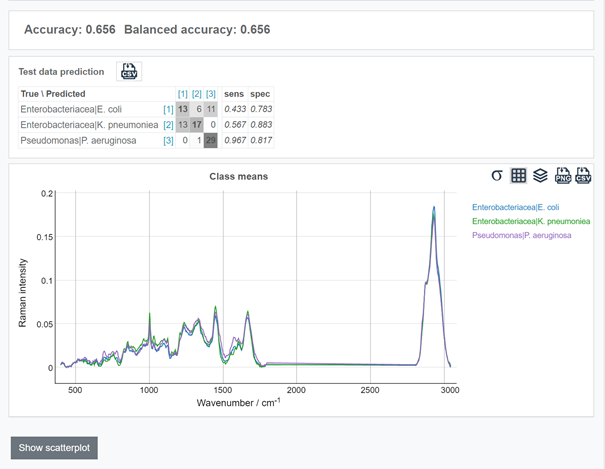
More insights can be obtained from the scatterplot. To access the scatter-plot, click "Show scatterplot" below the confusion table.
To see the complete report with parameters, click at the Report icon at the top panel.
Construct a model using preset parameters
Besides using a pre-trained model, users can use preset parameters to train the model themselves. To do so, follow the steps below:
Prior to importing the training data, the expertise level should be increased.
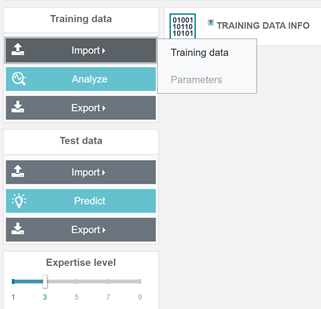
Import training data from folder "Construct model" by clicking Import --> Training data at the left panel named " Training data". Select the file with data named "ascitic-fluid_bacteria_minimal.zip".
Click the Data icon at the top panel to get an overview on the raw spectra and metadata.
Click the Calibration icon at the top panel to see mean standard spectra of 4-AAC (4-acetamidophenol / paracetamol) and the preset position of tabled peaks.
Import preset parameters file named "parameters_LDA_species.txt" (Import --> Parameters at the left panel named " Training data").
Click the Analyze button to execute the sequence of data processing steps. The icons for the executed steps will change colors at the top panel.
Take a few minutes to explore the outputs of the data processing steps by clicking through the steps at the top panel.
Go to the Model step and explore the confusion table with cross-validated predictions. Read the info about the difference between the evaluation types.
Below the table you can have a look at the mean plots for the classes.
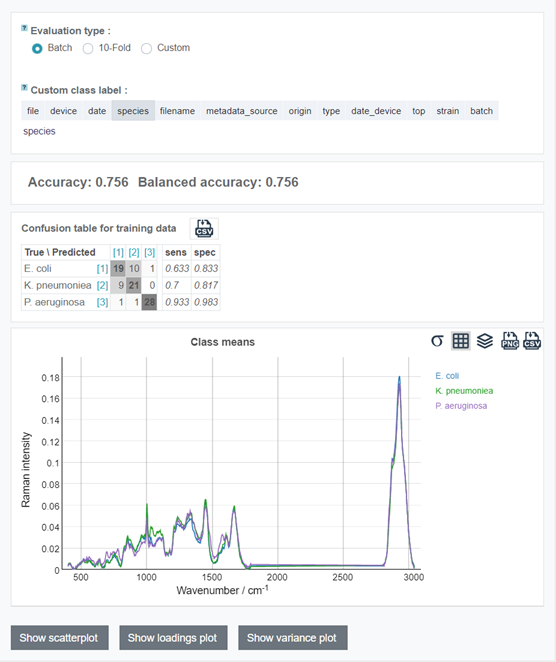
You can also check the model scatterplot by clicking on "Show scatterplot" button, model loadings by clicking on "Show loadings plot" button and PCA variance ratio plot with "Show variance plot" (may not be available for some models).
Have a look at the training data report by clicking on the Report icon at the top panel.
Adjust parameters
Depending on the task, it may be required to switch to a different type of statistical or machine learning model and adjust the wavenumber range of interest within the Raman spectral data.
Increase the expertise level using a slider at the respective panel. The buttons for performing individual processing steps should appear for every processing step. Besides that, wavenumber ranges can be adjusted for calibration and normalization steps. Moreover, different models can be accessed.

Go to the calibration step and set the wavenumber range roughly from 600 to 1750 cm-1 using the sliders " Used area" and "Excluded area". For a precise adjustment of the sliders, the arrows on a keyboard can be used.
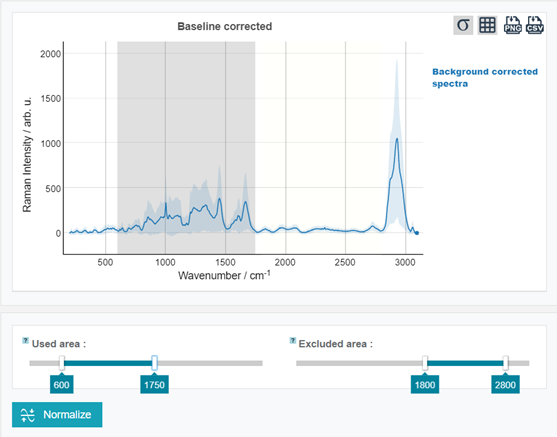
Scroll down, click "Normalize" and see how the result of the normalization step has changed.
Go to the Model step and try different classification and clustering models. Also, try adjusting the number of features. Click "Construct model" or "Analyze" (left panel) to apply the parameters.
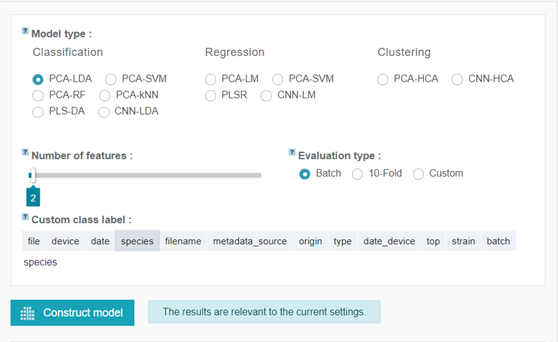
Try to find the best classification model and optimal number of features. Keep in mind that the Batch validation is the reliable way to validate the model and the mean sensitivity is a good metric for model performance.
Export the model and the parameters using Export --> Parameters at the Training data panel. You can reuse this model or parameters later by importing them or share them with other users.
Advanced parameters
More experienced users may find advanced controls very useful. Each parameter has a short description, available by pointing or clicking on the help icon next to the parameter name. To get an example of the advanced parameters usage follow the steps below:
Increase the expertise level.

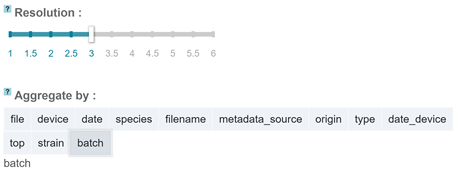
Go to the Calibration step. Set "Resolution" equal to 2 and set "Aggregate by" into "batch".
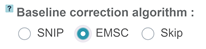
Go to the Baseline step and chose "EMSC" algorithm.
Go to the Model step and set hierarchical clustering model "(PCA-HCA)".

Click the "Analyze" button to receive the new results.
To set the parameters back to default click Import --> Parameters at the Training data panel and select the " parameters_default.txt" from the "Construct model" directory.